

Executive Summary
vAnalyzer is a business intelligence (BI) layer that integrates natively with vRx to transform raw vulnerability data into meaningful, actionable insights. By ingesting data every four hours from vRx, vAnalyzer provides security teams with near real-time visibility into their security posture through customizable dashboards, automated reporting, and trend analysis.
This document explores vAnalyzer's most valuable reports, what data they surface, how the underlying metrics are calculated, and what security decisions each report enables.
vAnalyzer Architecture
vAnalyzer operates as a dedicated reporting and analytics component that pulls data from vRx via API integration. The architecture consists of three primary layers:
Data Ingestion Layer
vAnalyzer connects to vRx using API credentials and pulls vulnerability, asset, and remediation data on a four-hour sync cycle. This near real-time ingestion ensures dashboards reflect current security posture without overwhelming the system with continuous polling.
Data Storage Layer
Ingested data is stored in a PostgreSQL database optimized for analytical queries. The schema supports historical trending, point-in-time snapshots, and cross-dimensional analysis (e.g., vulnerabilities by severity, by asset group, by time period).
Visualization Layer
The web-based dashboard is built on a business intelligence platform. This provides flexible visualization options including charts, tables, pie graphs, and trend lines all exportable to CSV, PDF, or PNG formats for external reporting.
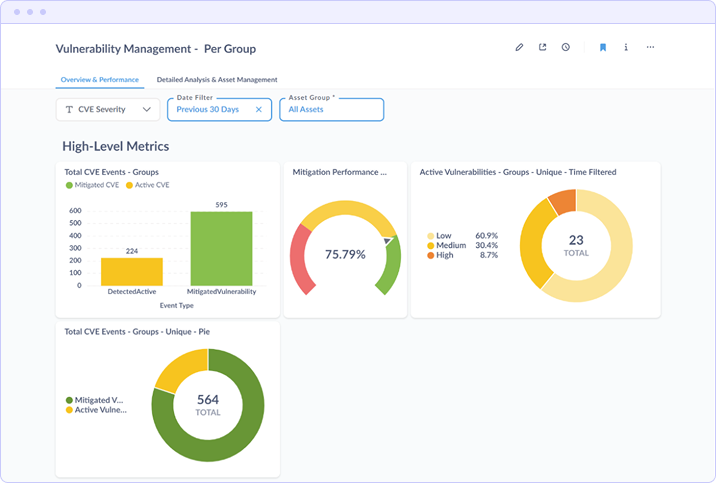
Report: Vulnerability Management Overview & Performance
The Overview & Performance dashboard provides executive-level visibility into the organization's vulnerability posture. It aggregates data across all monitored assets to surface key performance indicators that answer the fundamental question: "Are we reducing risk over time?"
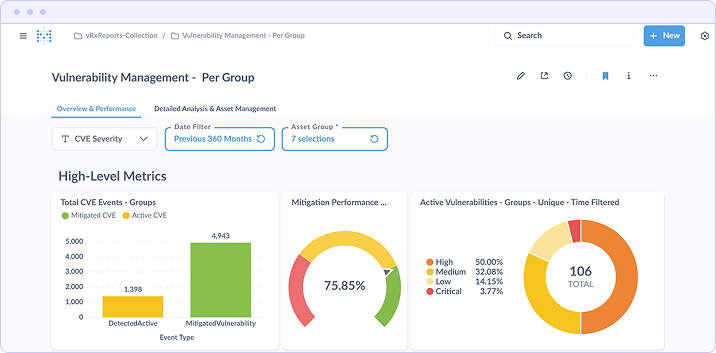
Key Metrics Displayed
- Total CVE Events by Group Compares detected active vulnerabilities against mitigated vulnerabilities, showing remediation progress as a ratio
- Mitigation Performance Percentage Calculates the proportion of detected vulnerabilities that have been successfully remediated (75.85% in the example shown)
- Active Vulnerabilities by Severity Breaks down remaining exposure by severity tier (Critical, High, Medium, Low) to inform prioritization decisions
How the Data Is Calculated
The mitigation performance metric divides the count of vulnerabilities with a "mitigated" status by the total count of detected vulnerabilities within the selected time filter and asset group. Severity breakdowns are derived from CVE severity scores normalized to the Critical/High/Medium/Low scale.
Decisions This Report Enables
- Resource allocation based on severity distribution
- Executive reporting on remediation velocity
- Identification of whether the security program is keeping pace with new vulnerabilities
Report: Mitigation Details & Severity Trends
The extended dashboard view adds operational depth to the high-level metrics, surfacing mitigation counts, performance targets, average remediation times, and trend analysis over time.
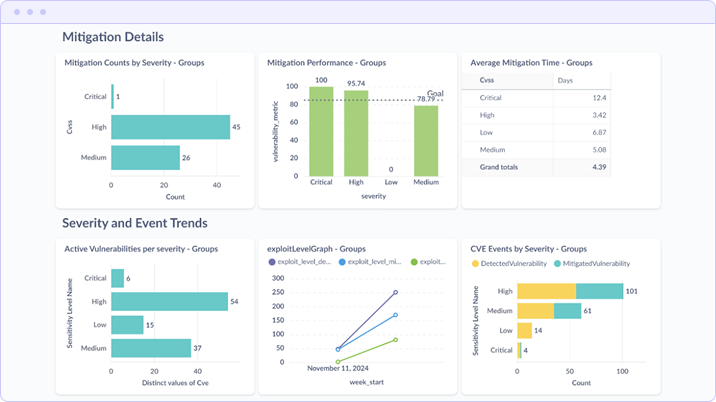
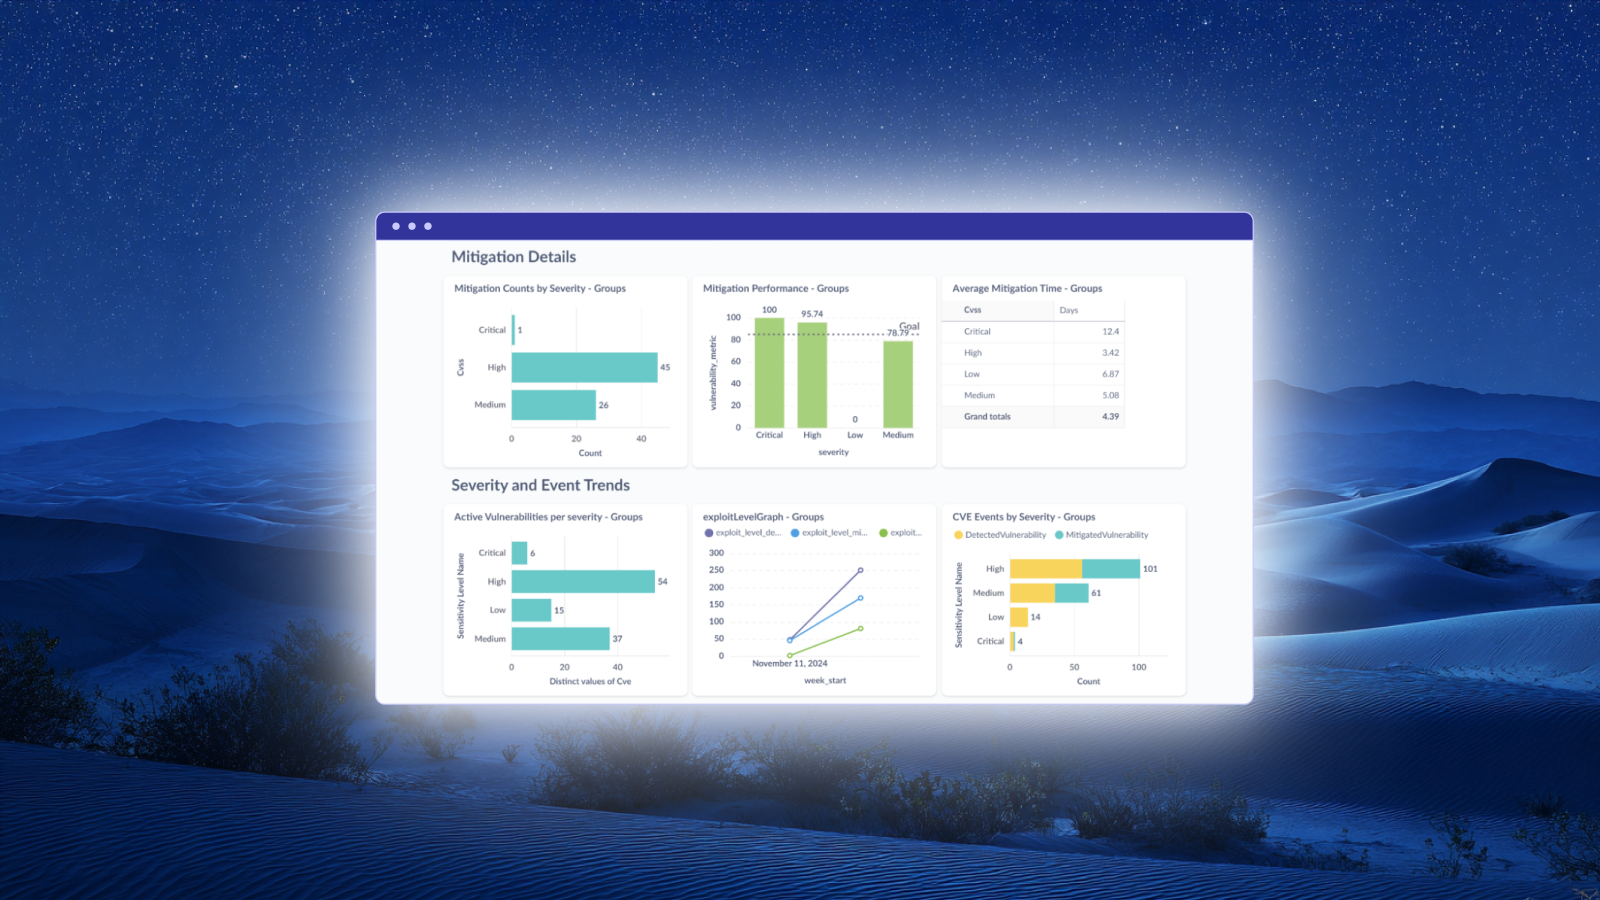
Mitigation Details Section
This section provides granular remediation metrics:
- Mitigation Counts by Severity Bar chart showing the absolute number of Critical, High, and Medium vulnerabilities remediated
- Mitigation Performance by Severity Performance percentage per severity tier, with a configurable goal line (78.79% target shown) to track SLA adherence
- Average Mitigation Time Mean time to remediate (MTTR) calculated per severity level. The example shows Critical at 12.4 days, High at 3.42 days, and Medium at 5.08 days
Severity and Event Trends Section
The trend analysis components track vulnerability dynamics over time:
- Active Vulnerabilities per Severity Current distribution of open vulnerabilities requiring attention
- Exploit Level Graph Tracks exploit activity over time, helping identify periods of elevated risk
- CVE Events by Severity Compares detected vs. mitigated vulnerabilities by severity, showing whether remediation is outpacing new discoveries
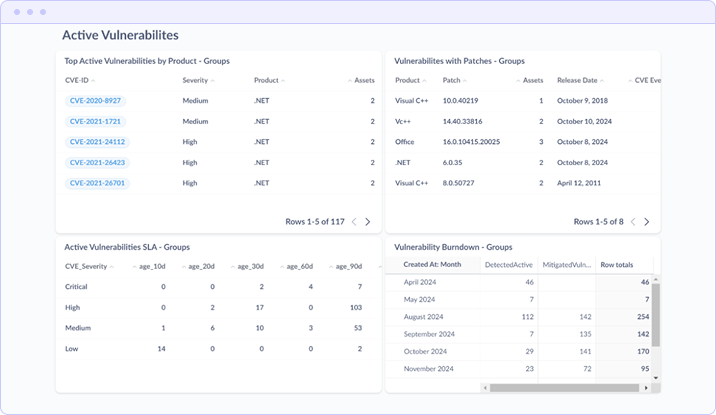
Active Vulnerabilities Section
The bottom section provides actionable detail on open vulnerabilities:
- Top Active Vulnerabilities by Product Lists specific CVEs with severity, affected product, and asset count
- Vulnerabilities with Patches Shows which vulnerabilities have available patches, including patch version and release date
- Active Vulnerabilities SLA Age distribution table showing how long vulnerabilities have remained open (10d, 20d, 30d, 60d, 90d buckets)
- Vulnerability Burndown Monthly tracking of detected vs. mitigated vulnerabilities showing remediation trajectory
Report: Detailed Analysis & Asset Management
The Detailed Analysis view shifts focus from aggregate metrics to asset-level and product-level analysis. This report supports operational decision-making by identifying which specific assets and applications are driving vulnerability counts.
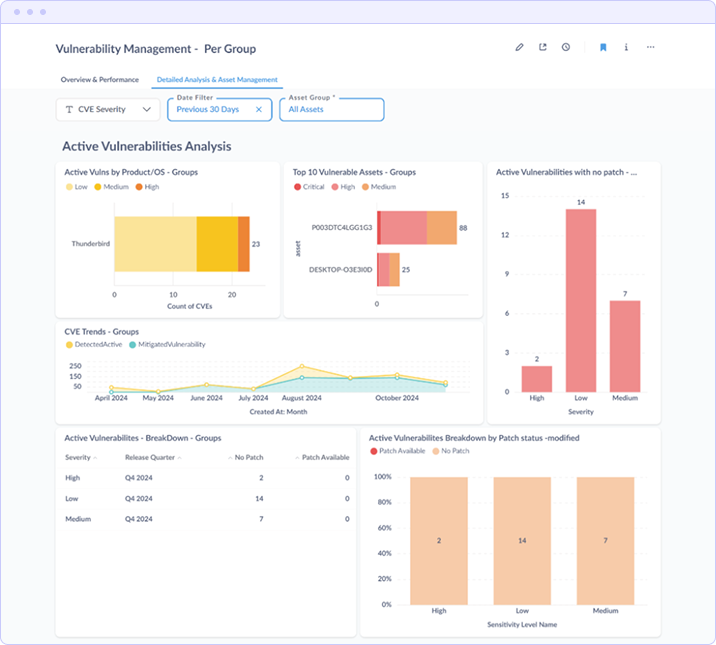
Active Vulnerabilities Analysis
- Active Vulns by Product/OS Identifies which applications contribute the most vulnerabilities (e.g., Thunderbird with 23 CVEs in the example)
- Top 10 Vulnerable Assets Ranks individual assets by vulnerability count with severity breakdown, enabling targeted remediation
- Active Vulnerabilities with No Patch Surfaces risks where patching is not an option, indicating where compensating controls may be required
CVE Trends & Patch Availability
- CVE Trends Graph Time-series visualization comparing detected vs. mitigated vulnerabilities over months, showing whether remediation velocity exceeds discovery rate
- Active Vulnerabilities Breakdown by Patch Status Categorizes open vulnerabilities by whether patches are available, helping prioritize patchable items
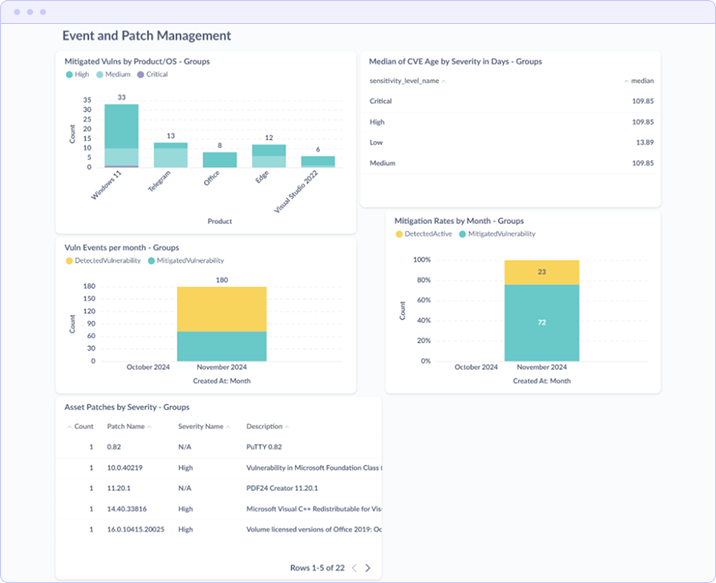
Event and Patch Management
- Mitigated Vulns by Product/OS Tracks remediation success by application, showing where patching efforts have been most effective
- Median CVE Age by Severity Calculates median time vulnerabilities remain open, segmented by severity tier
- Vuln Events per Month Monthly comparison of detected vs. mitigated vulnerabilities
- Mitigation Rates by Month Percentage-based view showing remediation rates trending over time
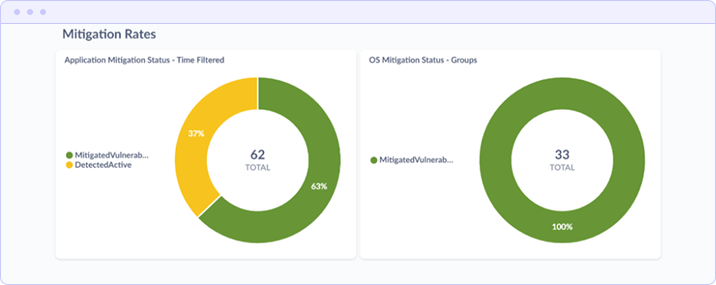
Mitigation Rates
The bottom section displays application-specific and OS-specific mitigation rates as donut charts, providing quick visual reference for remediation coverage. The example shows Application Mitigation Status at 37% mitigated/63% active and OS Mitigation Status at 100% mitigated.
Report: Patch Status & History
The Patch Status/History report tracks remediation executionnot just what vulnerabilities exist, but what actions have been taken to address them. This report provides audit-ready documentation of patching activities.
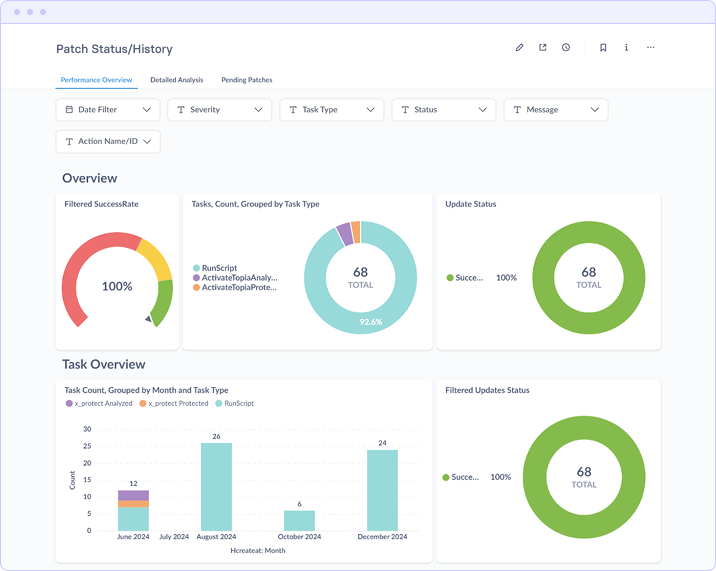
Performance Overview
The top section displays aggregate patching metrics:
- Filtered Success Rate Percentage of patch deployment tasks that completed successfully (100% in the example)
- Tasks Count by Type Breakdown of remediation actions by category (RunScript, ActivateTopiaAnalysis, ActivateTopiaProtection)
- Update Status Overall completion percentage for patch deployment activities (92.6% in the example)
Task Overview
The Task Count graph provides historical visibility into patching activity volume over time. This enables correlation between patching activity and vulnerability reduction, identification of peak remediation periods, and capacity planning for future maintenance windows.
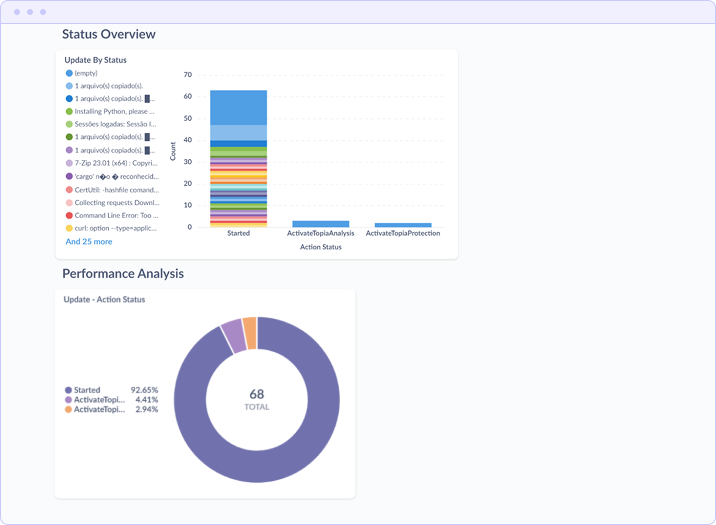
Status Overview
The Update By Status chart categorizes patch tasks by their current state, enabling identification of failed or stalled deployments that require attention.
Performance Analysis
The bottom section breaks down task execution by action type and status, showing the distribution of Started, ActivateTopiaAnalysis, and ActivateTopiaProtection actions. The example shows 92.65% of actions in Started status, indicating successful task initiation.
Custom Dashboards & KPI Configuration
vAnalyzer's foundation supports creation of custom dashboards beyond the standard reports. Security teams can define organization-specific KPIs and build visualizations tailored to their reporting requirements.
Customization Capabilities
- Executive Dashboards High-level views designed for board presentations and strategic planning sessions
- Operational Dashboards Granular views for security analysts showing asset-level detail and remediation queues
- Multi-Tenant Views Segmented dashboards for MSPs managing multiple client environments
- Custom KPIs User-defined metrics aligned with organizational security goals and SLAs
Export Formats
All reports support multiple export formats for integration with external reporting workflows:
- CSV Raw data export for spreadsheet analysis and custom processing
- PDF Formatted reports for compliance documentation and executive distribution
- PNG Chart images for embedding in presentations and documents
- API Access Programmatic data retrieval for integration with other BI platforms
Compliance Reporting Capabilities
vAnalyzer supports compliance reporting by generating documented evidence of vulnerability management activities. When the relevant compliance audit data is available within the vRx dataset, vAnalyzer can produce reports aligned with major security frameworks.
Supported Frameworks
- PCI DSS Vulnerability management and remediation timeline documentation for payment card environments
- CMMC Cybersecurity maturity evidence for federal contractor requirements
- NIS2 Security metrics reporting for EU directive compliance
- Cyber Insurance Remediation effort documentation to satisfy insurer due diligence requirements
Note: vAnalyzer provides reporting and audit capabilities but does not establish compliance independently. Compliance status depends on the underlying vRx data and organizational security controls.
Deployment Architecture
vAnalyzer is available in two deployment configurations:
Self-Hosted Deployment
The open-source version is available via GitHub and runs on Docker containers. This option provides full control over the deployment environment and supports integration with existing infrastructure. The technology stack includes Docker for containerization, PostgreSQL for data storage, Python for data processing, and a visualization visualization.
Vicarius-Hosted Solution
The managed cloud-hosted version includes enterprise support and maintenance, eliminating infrastructure management overhead while providing the same reporting capabilities.
System Requirements (Self-Hosted)
- < 500 assets: 2 Core CPU, 4 GB RAM, 20 GB Disk
- 500–1000 assets: 2 Core CPU, 8 GB RAM, 30 GB Disk
- > 1000 assets: 4 Core CPU, 12 GB RAM, 50 GB Disk
- Recommended OS: Ubuntu 22.04 (other Docker-compatible operating systems supported)
Summary
vAnalyzer transforms raw vulnerability data from vRx into structured intelligence that supports security decision-making at every organizational level. The platform's core reports provide:
- Executive visibility into organizational risk posture and remediation progress
- Operational metrics for prioritizing remediation efforts and tracking SLA adherence
- Asset-level analysis identifying highest-risk systems and applications
- Compliance documentation supporting audit requirements for major security frameworks
By consolidating vulnerability data into a unified reporting layer, vAnalyzer enables security teams to focus on risk reduction rather than data reconciliation.