


The vulnerability prioritization problem
Security teams are drowning in data. The average enterprise scan identifies hundreds of thousands of vulnerabilities, with traditional tools flagging thousands as "Critical" based solely on CVSS scores. This creates an impossible situation: a CVSS 9.8 vulnerability on a decommissioned test server receives the same priority as an identical flaw on your internet-facing production database despite representing vastly different actual risks to your organization.
The core issue is that CVSS measures severity (potential impact), not risk (likelihood of impact in your specific environment). What's needed is a mathematical framework that combines severity with real-world threat intelligence and organizational context to produce actionable priorities.
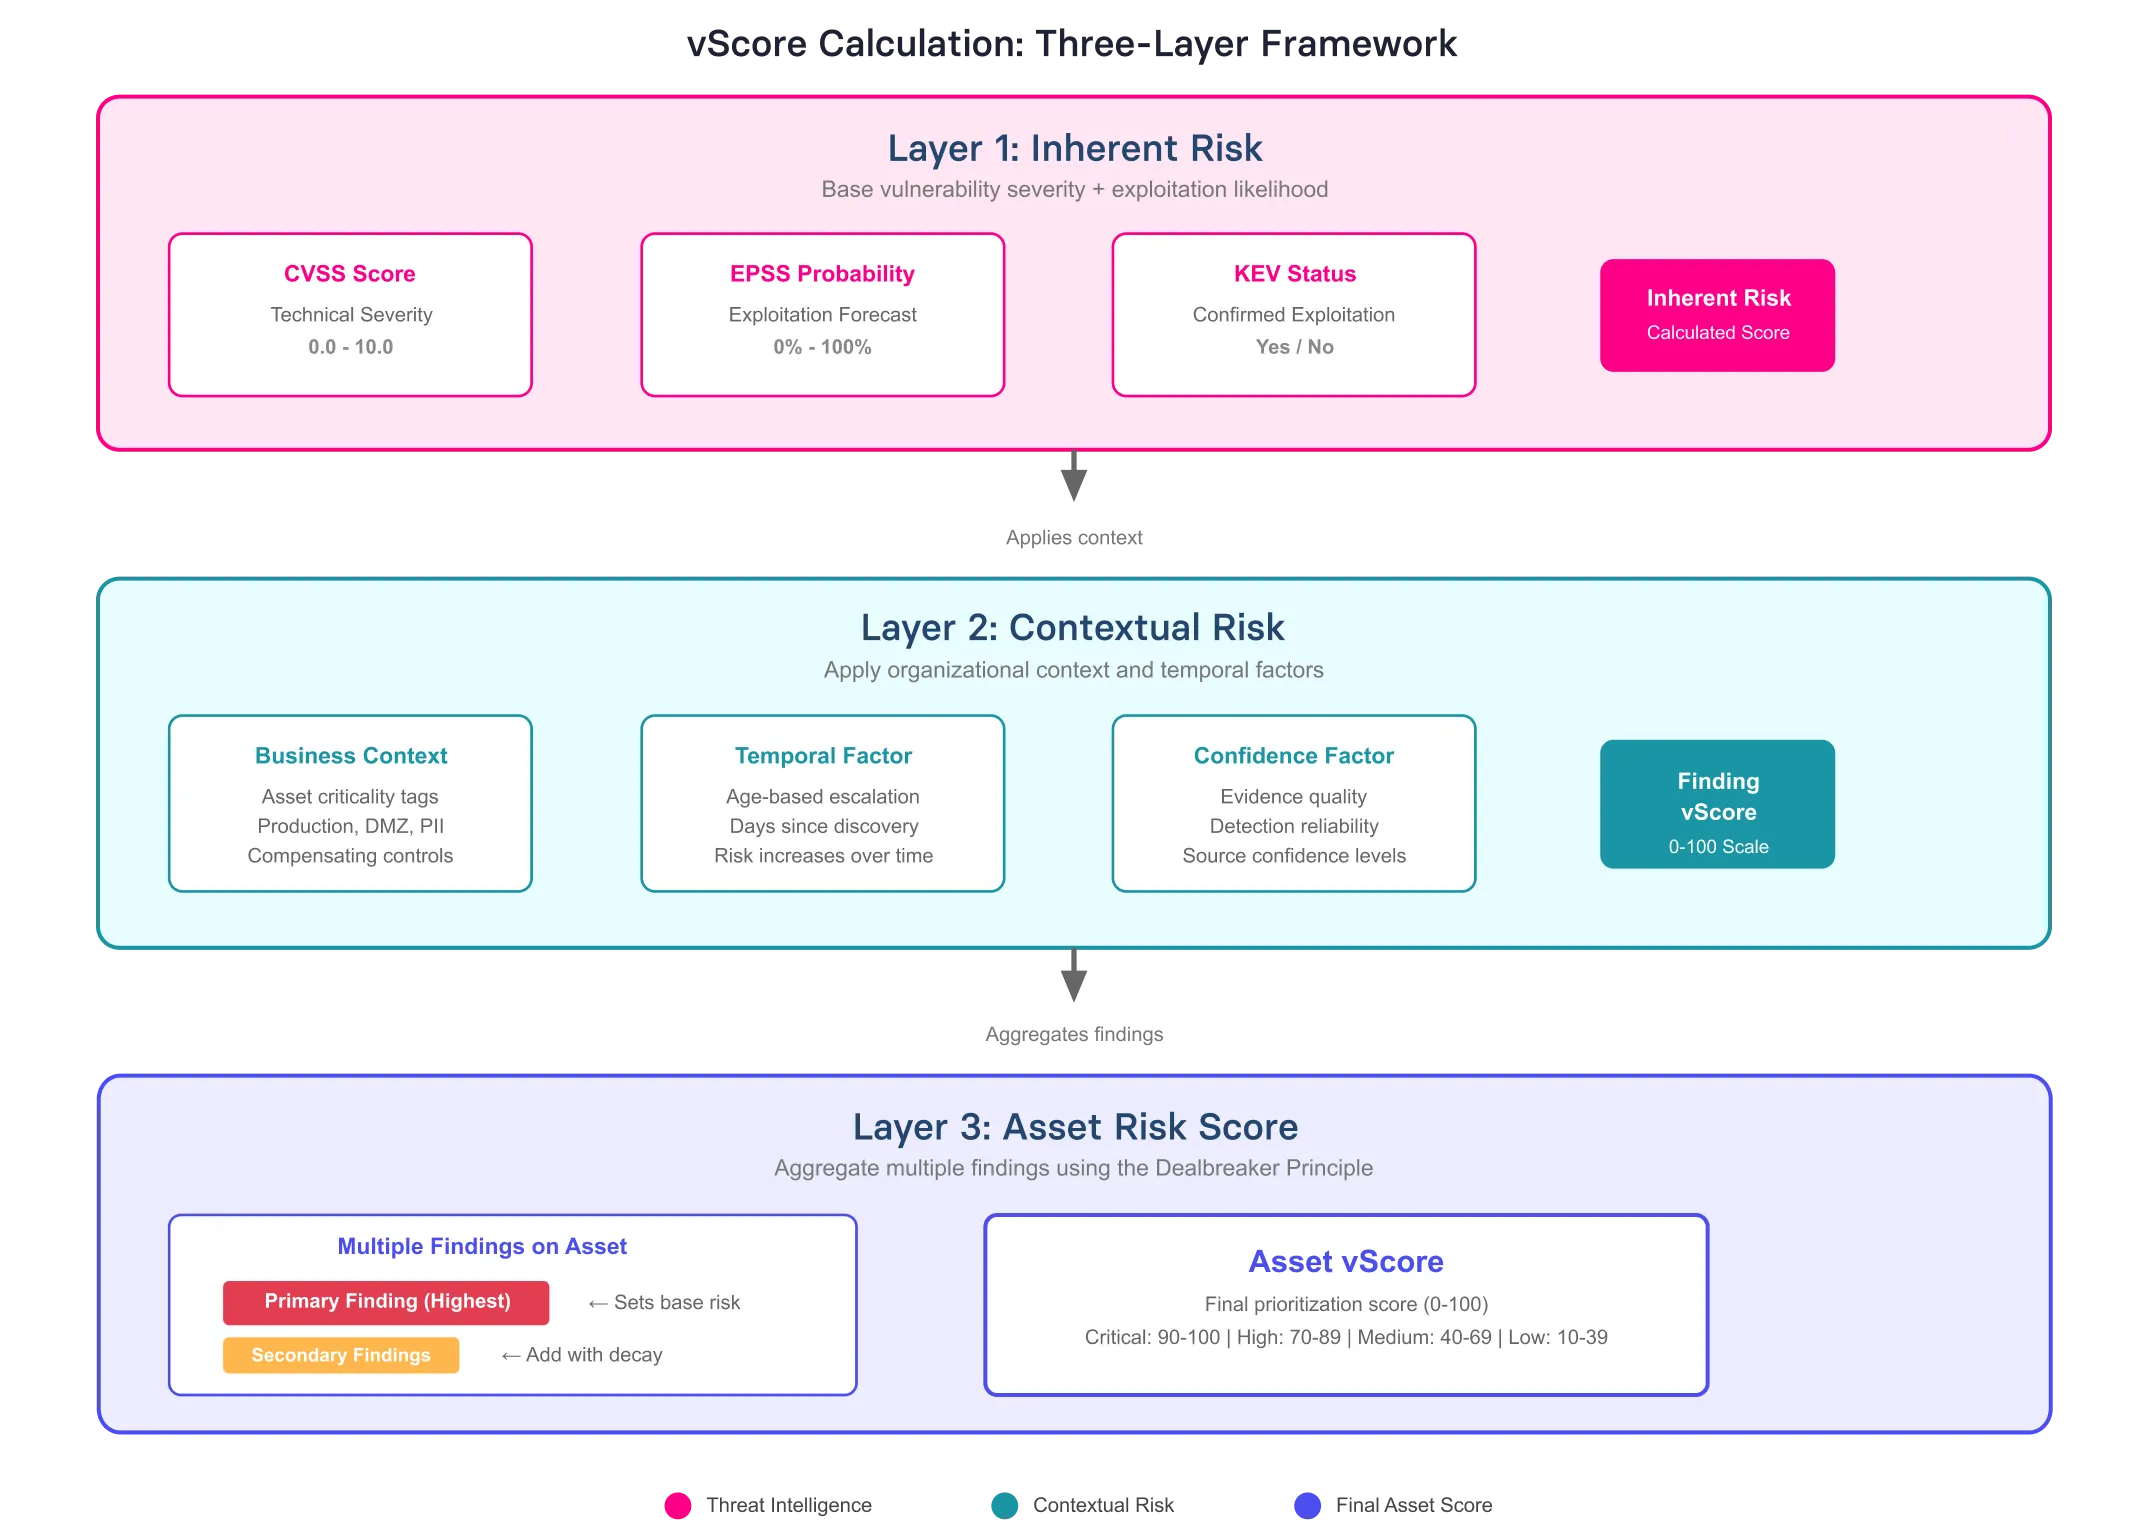
This is the challenge vRx's risk scoring engine solves through a three-layer mathematical model that transforms raw vulnerability data into context-aware risk scores.
Layer 1: Inherent Risk - fusing severity with threat intelligence
The foundation of effective risk scoring requires answering three distinct questions about each vulnerability:
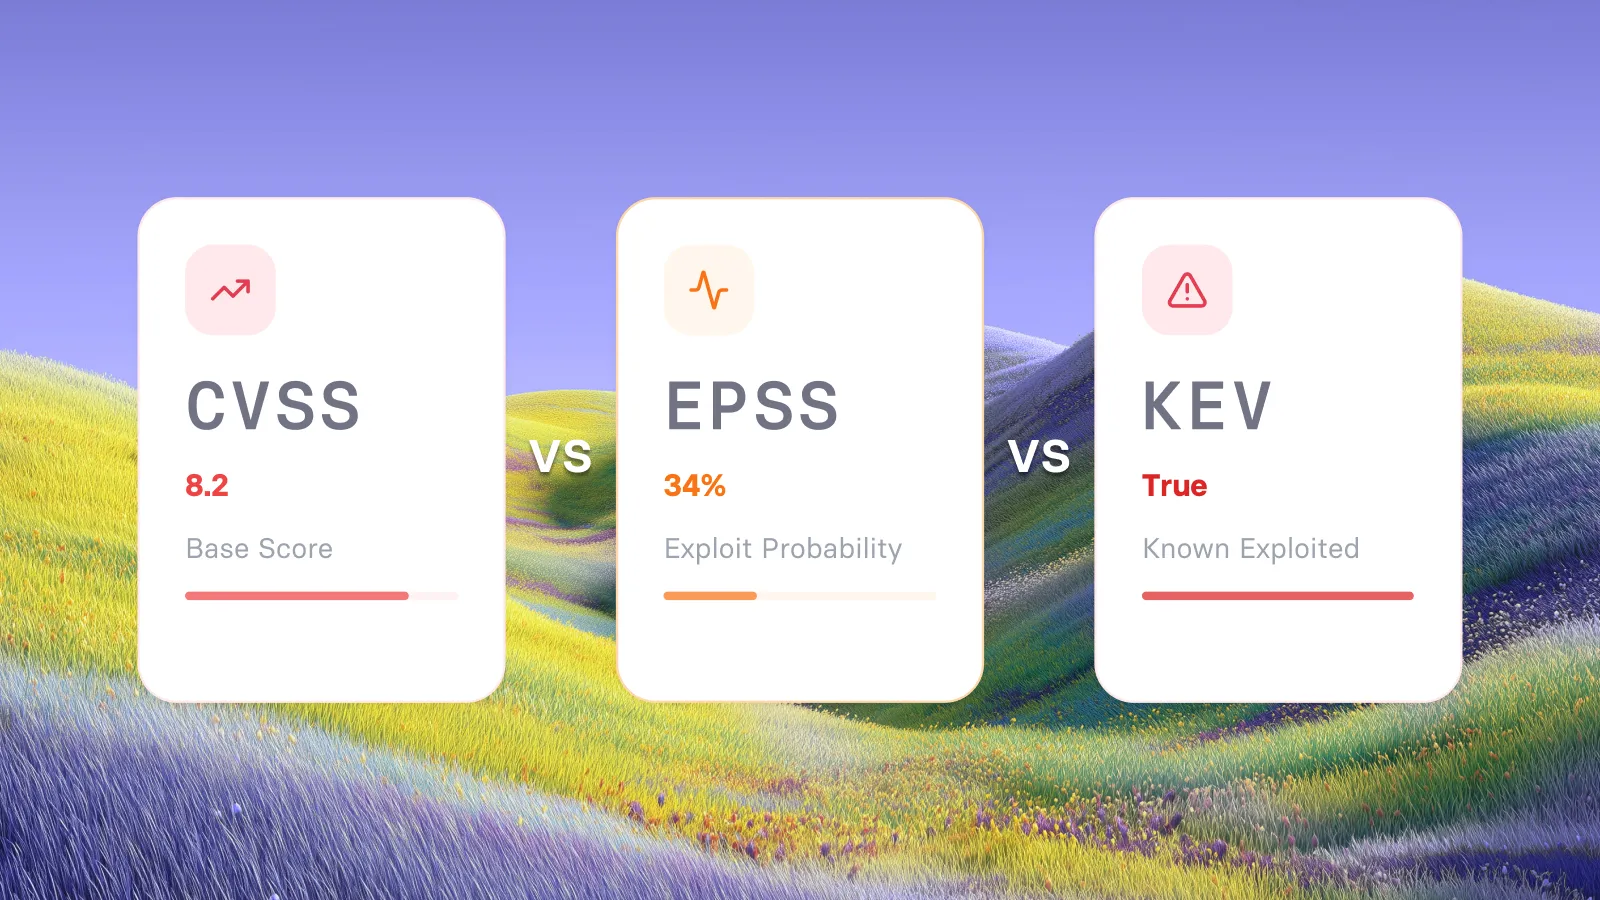
How severe is the potential impact? (CVSS: 0-10 scale)
How likely is exploitation in the wild? (EPSS: 0-100% probability)
Is it being actively exploited right now? (KEV: yes/no)
Understanding the threat likelihood component
The first innovation in vRx's approach is how it calculates exploitation likelihood by combining EPSS and KEV:
Threat Likelihood combines EPSS probability with KEV status. When a vulnerability is in KEV, the likelihood score increases significantly.
The KEV boost factor controls how much confirmed exploitation increases the likelihood score.
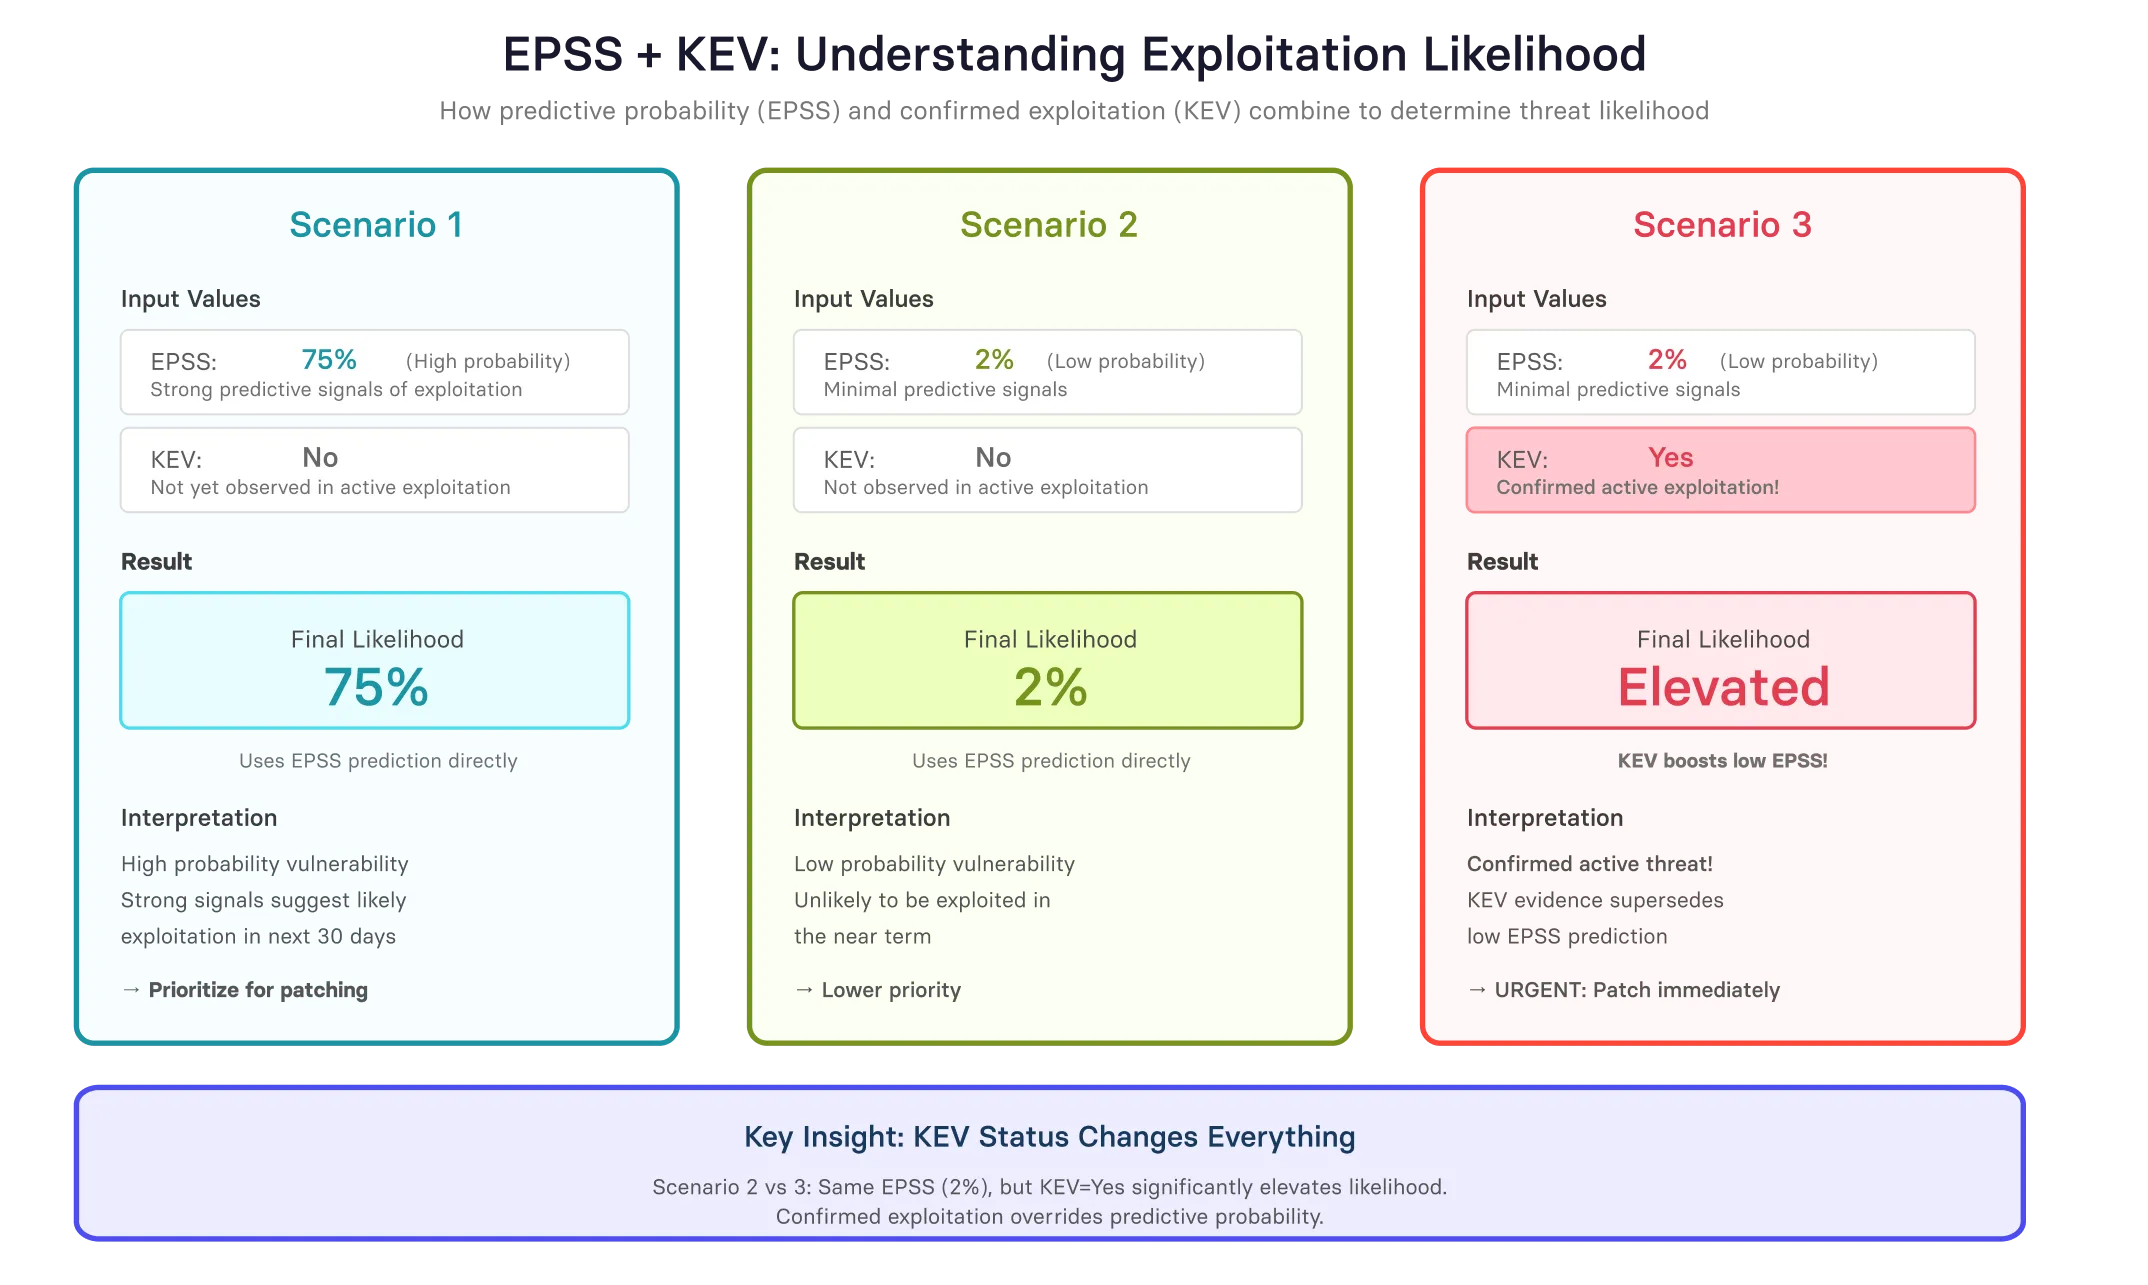
Why this formula matters: When KEV = No, likelihood simply equals EPSS (the predictive probability). But when KEV = Yes, likelihood jumps dramatically often from single digits to 60%+ or higher. This reflects a fundamental shift from "might happen" to "is actively happening."
The EPSS-KEV relationship explained
A common point of confusion: "How can a vulnerability have an EPSS of 2% but KEV status of Yes?"
The key is understanding what each metric actually measures:
- EPSS predicts the probability that any given organization will see exploitation attempts over the next 30 days, based on patterns across all organizations
- KEV confirms that active exploitation has been observed somewhere, by someone
- Low EPSS + KEV = Yes typically indicates targeted attacks (APT campaigns, industry-specific exploits) rather than widespread commodity exploitation
Real-world example: A zero-day actively exploited by a nation-state APT targeting critical infrastructure triggers KEV = Yes. However, if the attack requires sophisticated capabilities and specific configurations, EPSS remains low (2-5%) because the vast majority of organizations won't encounter exploitation attempts.
The Inherent risk formula
Once likelihood is determined, it combines with severity (CVSS) to produce inherent risk:
Inherent Risk is calculated by combining CVSS severity with the threat likelihood, giving appropriate weight to both factors.
The weighting between severity and exploitation likelihood is configurable. A typical configuration gives:
- 40% weight on potential impact (CVSS)
- 60% weight on exploitation likelihood (EPSS/KEV)
Practical example - Log4Shell (CVE-2021-44228):
- CVSS: 10.0, EPSS: 97.4%, KEV: Yes
- Likelihood: Very High (98%+) due to confirmed active exploitation
- Inherent Risk: 99 (near maximum due to critical severity + active exploitation)
This vulnerability rightfully scores at the absolute top of the scale.
Contrast with a theoretical high-severity vulnerability:
- CVSS: 9.0, EPSS: 1%, KEV: No
- Likelihood: 0.01 (1%)
- Inherent Risk: 36.5 (moderate due to low exploitation likelihood despite high CVSS)
Same critical CVSS band, but 63 points lower in actual risk due to negligible exploitation likelihood.
Layer 2: Contextual Risk - where vulnerability meets reality
Inherent risk treats all assets equally. The context layer applies organizational reality through three multipliers: business context tags, temporal escalation, and evidence confidence.
Business context through tags
Organizations apply tags to assets and vulnerabilities to reflect business criticality:
Context Multiplier is derived from the combined effect of all applicable tags, with dampening applied to prevent extreme score inflation.
The multiplier is based on the combined effect of all applicable asset tags.
Why logarithmic dampening? Without it, multiplicative tags create unusable score inflation. An asset with five 2× tags would produce a 32× multiplier (2^5). The logarithm preserves relative rankings while preventing explosion:
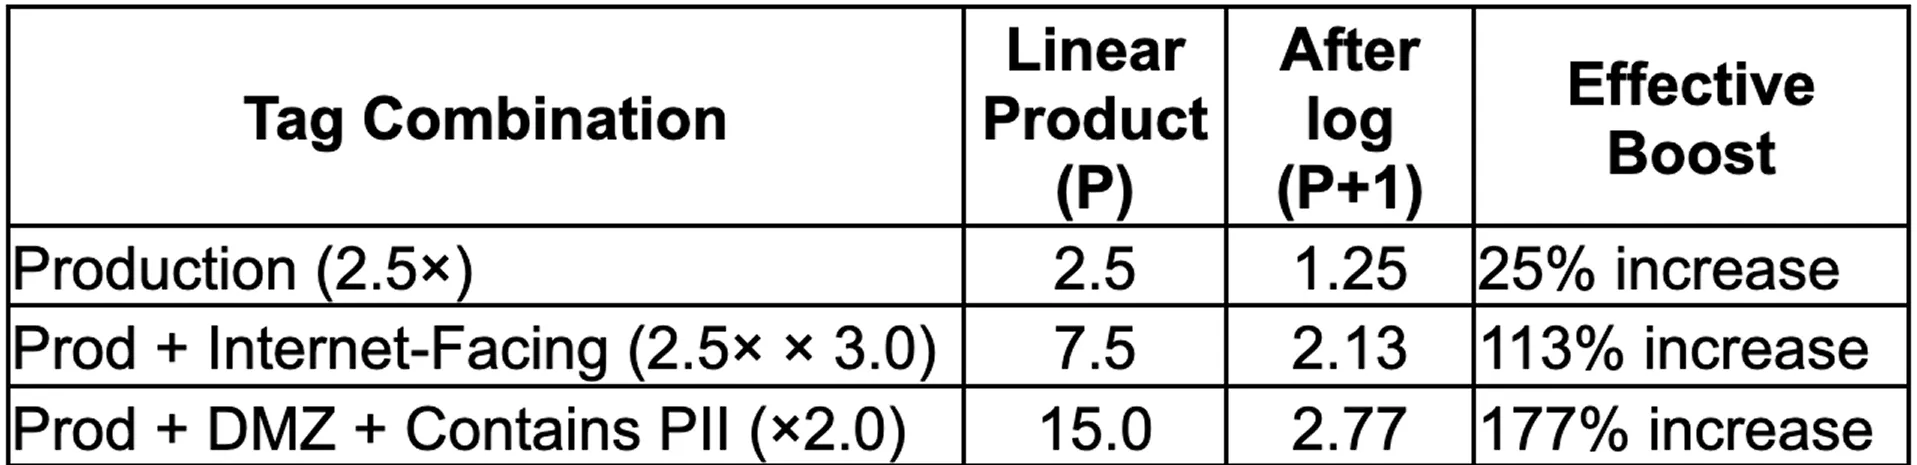
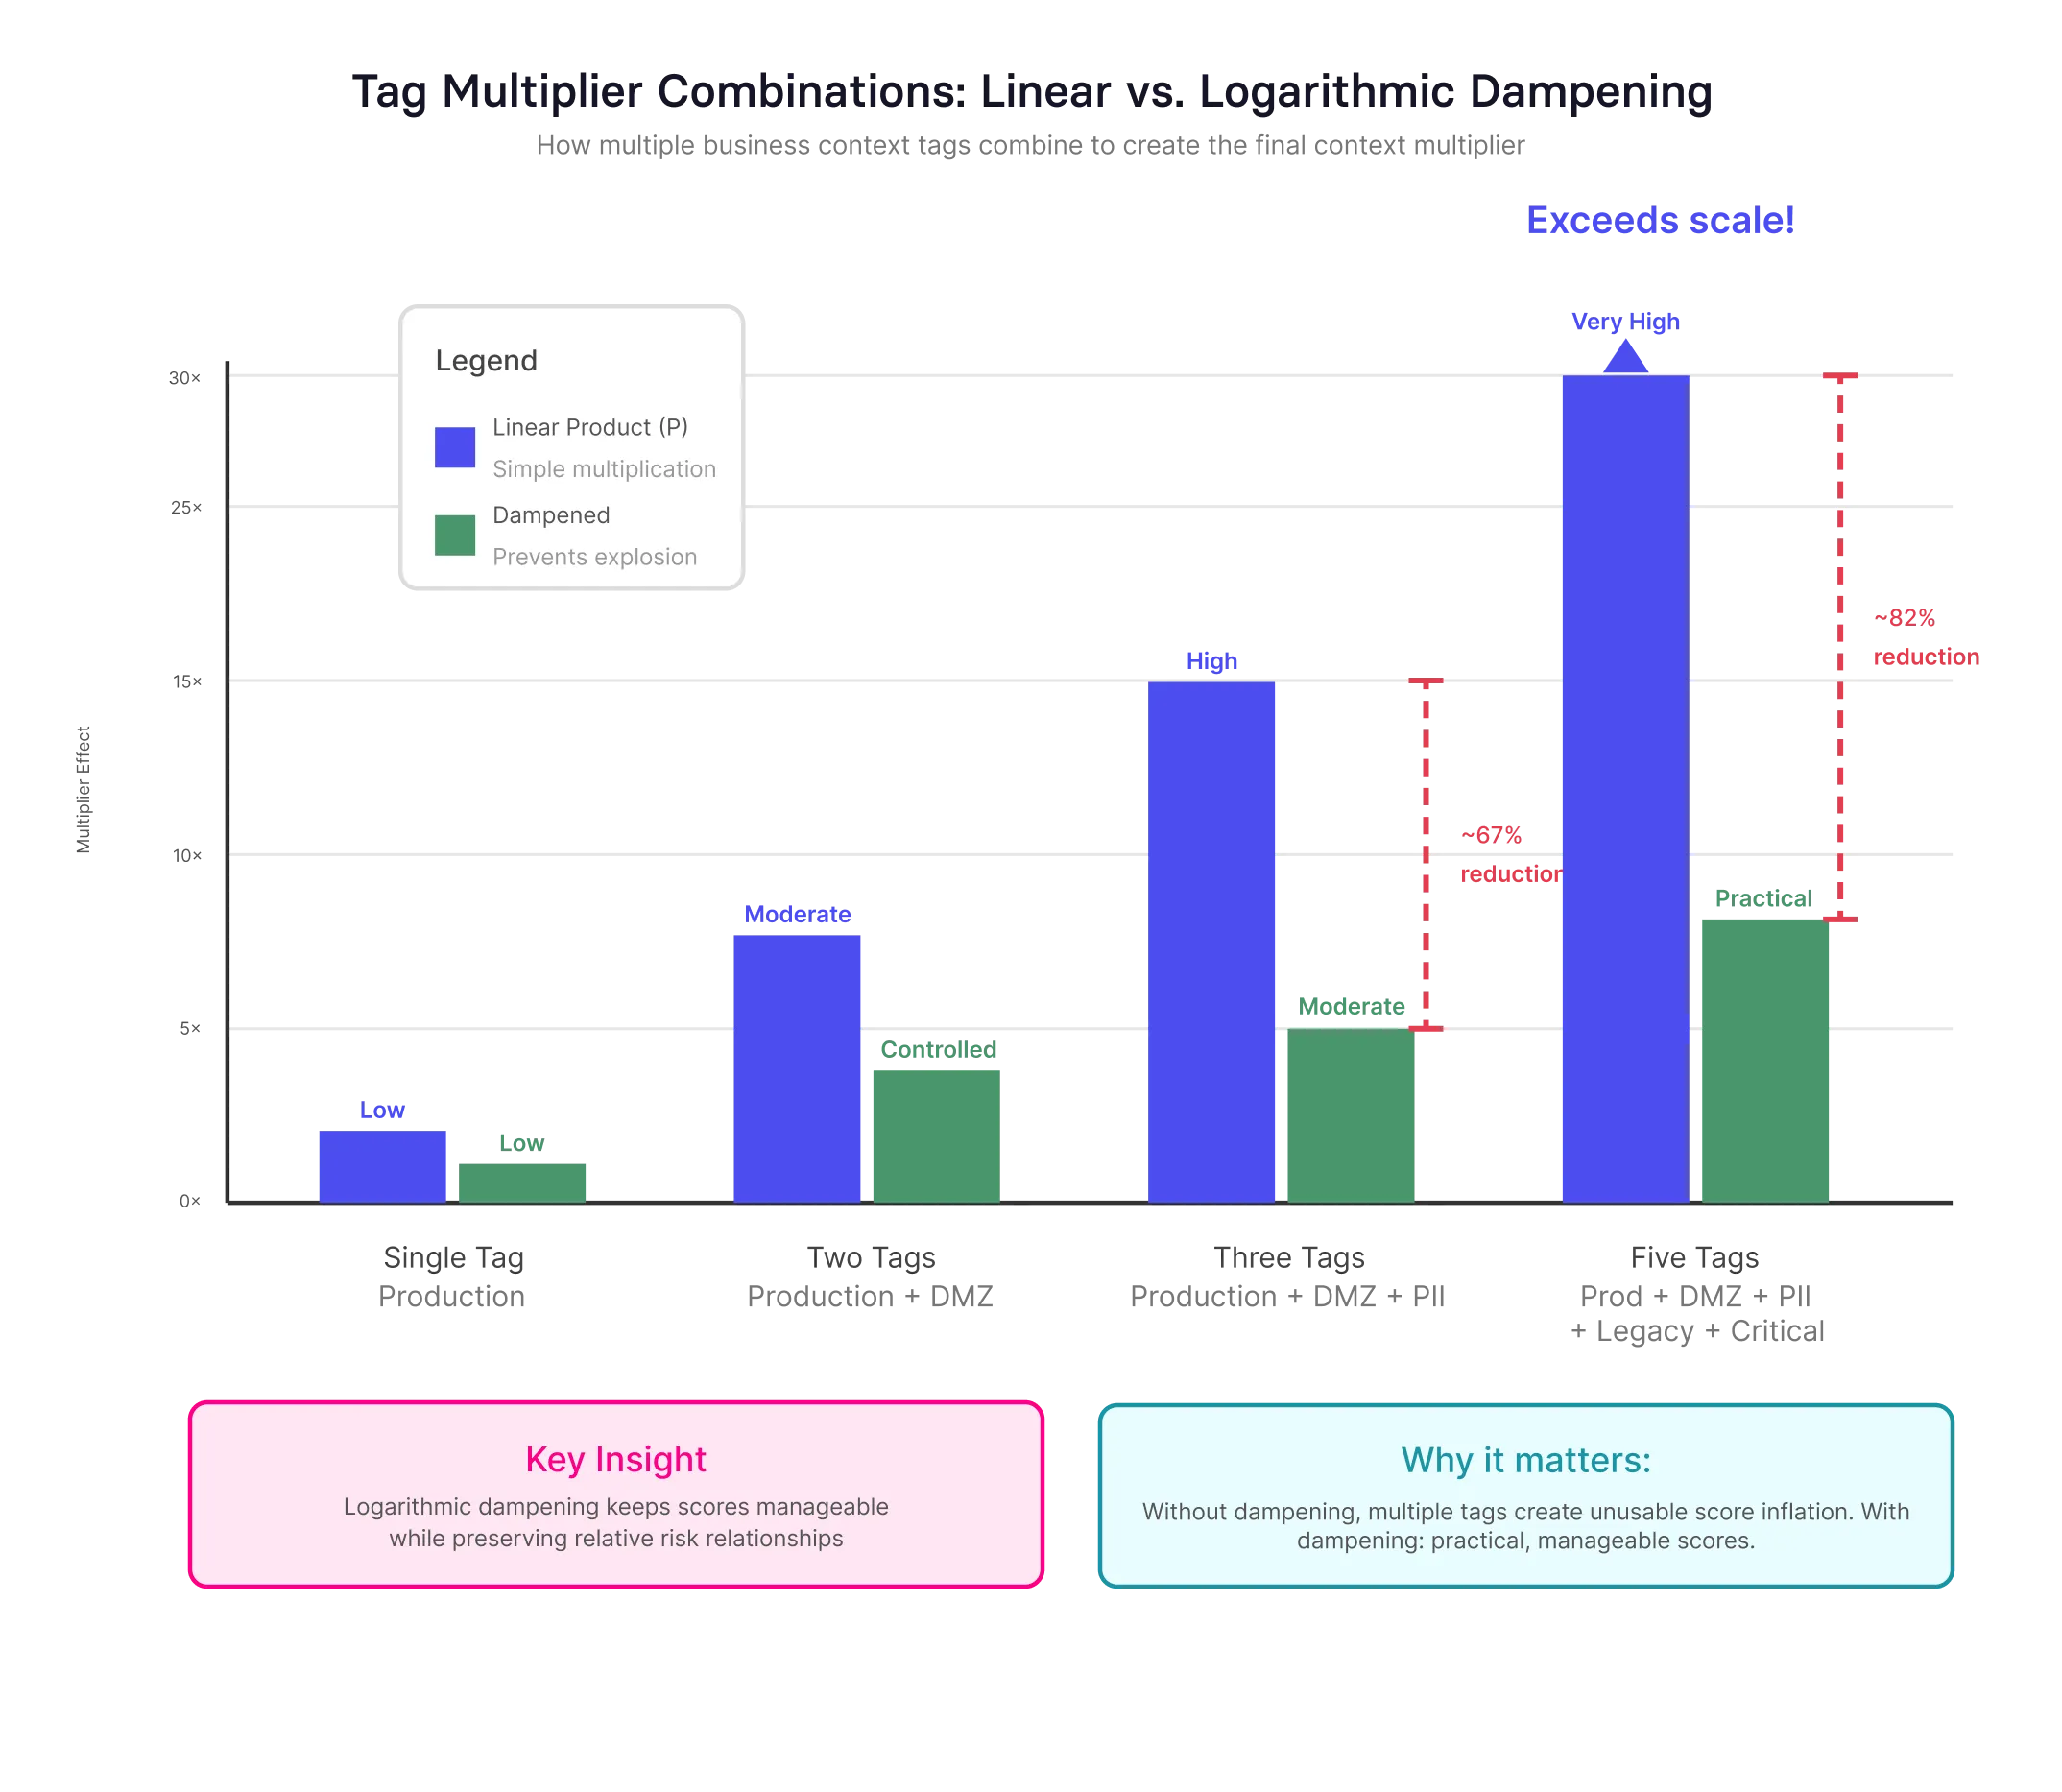
Example tags and their typical multipliers:
- Internet-Facing (DMZ): 3.0× (high exposure)
- Production Environment: 2.5× (business critical)
- Contains PII/Payment Data: 2.0× (compliance risk)
- Firewall Protected: 0.5× (compensating control)
- Decommissioned: 0× (no active risk)
Tags with multipliers less than 1.0 represent mitigating controls that reduce risk. A multiplier of 0 zeros out the entire score, reflecting assets with no actual exposure.
Temporal escalation: the ticking clock
Risk changes over time. A vulnerability unpatched for 180 days represents greater risk than one discovered yesterday attackers have had more time to weaponize exploits and find vulnerable targets:
Temporal Factor increases gradually based on how long a vulnerability has remained unpatched, with the effect leveling off over time.
Parameters:
- Direction: Controls whether older or newer vulnerabilities are prioritized
- Rate: Controls how quickly the escalation effect increases over time
Example with default settings:
- Day 1: Minimal increase (newly discovered)
- Day 30: Moderate increase (about one month old)
- Day 180: Significant increase (six months old)
- Day 365: Near maximum increase (one year old)
The logarithm ensures the effect is most pronounced initially, then gradually levels off reflecting the reality that exploitation tooling typically emerges in the first weeks and months.
Evidence confidence: filtering false positives
Not all vulnerability detections are equally reliable. vRx weights evidence sources by confidence level:
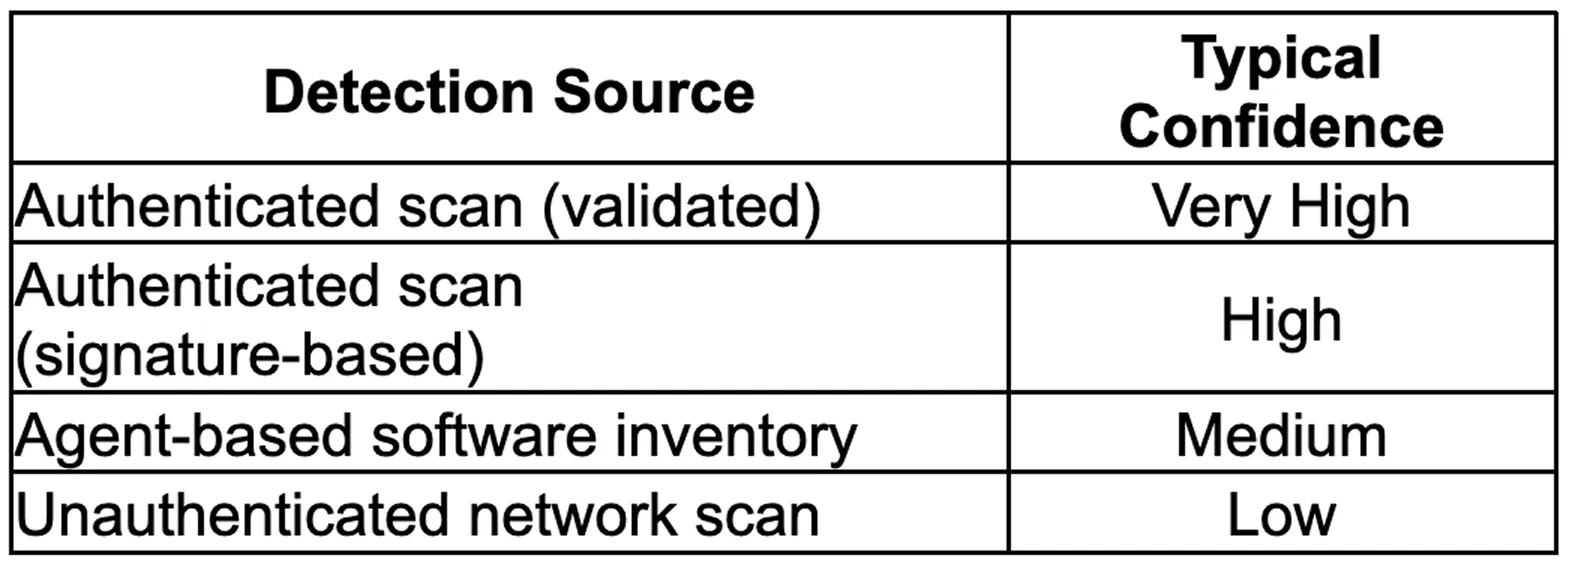
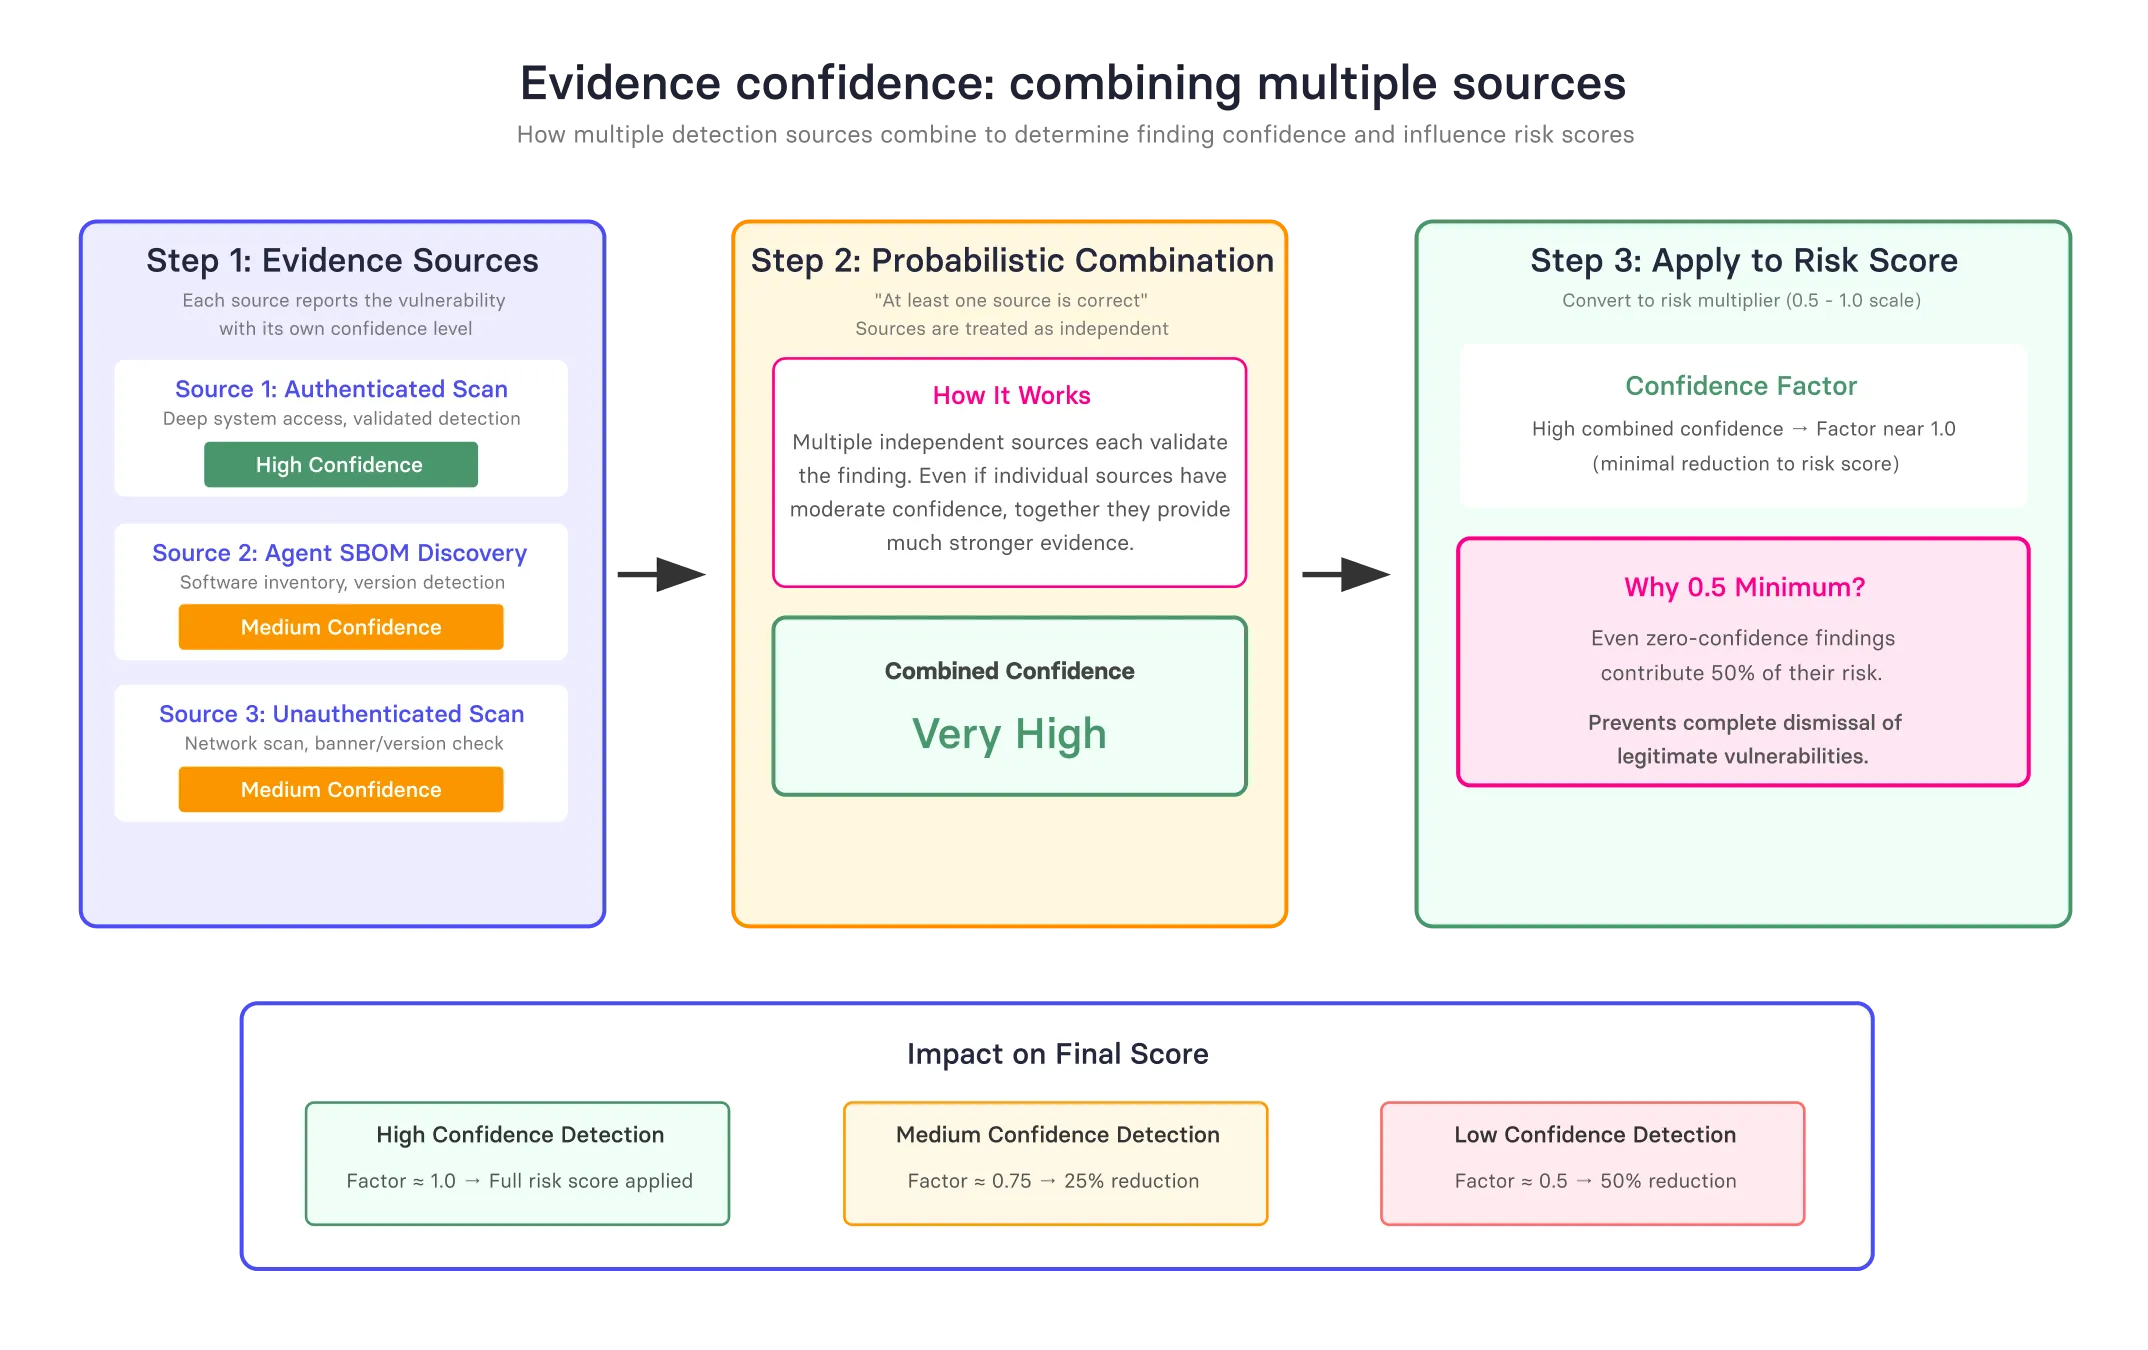
When multiple sources report the same vulnerability, they combine probabilistically:
Combined Confidence increases when multiple independent sources detect the same vulnerability, providing stronger evidence.
Two independent 60% confidence detections combine to 84% confidence (not 120% or simply 60%).
This combined confidence then attenuates the risk score:
Confidence Factor converts the combined confidence into a score multiplier, with a minimum floor to ensure findings are never completely discarded.
The 0.5 floor is critical: Even a zero-confidence finding contributes 50% of its inherent risk. This prevents legitimate vulnerabilities from being completely discarded due to detection limitations, while still significantly de-prioritizing uncertain findings.
Computing the finding risk score
All contextual factors combine multiplicatively with inherent risk:
Raw Risk is calculated by multiplying Inherent Risk with all contextual factors (Context Multiplier, Temporal Factor, and Confidence Factor).
This raw score is then normalized to a 0-100 scale using asymptotic compression:
Finding vScore normalizes the raw risk to a 0-100 scale, ensuring scores never exceed 100 regardless of input values.
A configurable scaling factor controls how sensitive the score curve is to changes in raw risk values.
Why exponential normalization? This mathematical function guarantees scores never exceed 100, regardless of input magnitude. Unlike linear normalization, it preserves relative distances between scores while compressing extreme outliers.
Practical example - Internet-facing production server:
- Inherent Risk: 66.5 (CVSS 8.5, EPSS 35%, no KEV)
- Tags: Production (2.5×), DMZ (3.0×), Remote Exploitable (2.5×)
- Context Multiplier: High (approximately 3×) due to combined critical tags
- Temporal_Factor: 1.21 (14 days old)
- Confidence_Factor: High (high-quality authenticated scan)
- Raw Risk: Very High (all factors combine to significantly elevate the score)
- Finding vScore: 98.7 (normalized to 0-100 scale)
This vulnerability correctly scores near the top of the scale due to its dangerous combination of severity, context, and confirmed exploitability.
Layer 3: Asset Risk - the dealbreaker principle
The final challenge: how do you score an asset with multiple vulnerabilities? Is a server with one Critical vulnerability riskier than one with fifty High vulnerabilities?
vRx implements a sophisticated aggregation model based on the "Dealbreaker Principle."
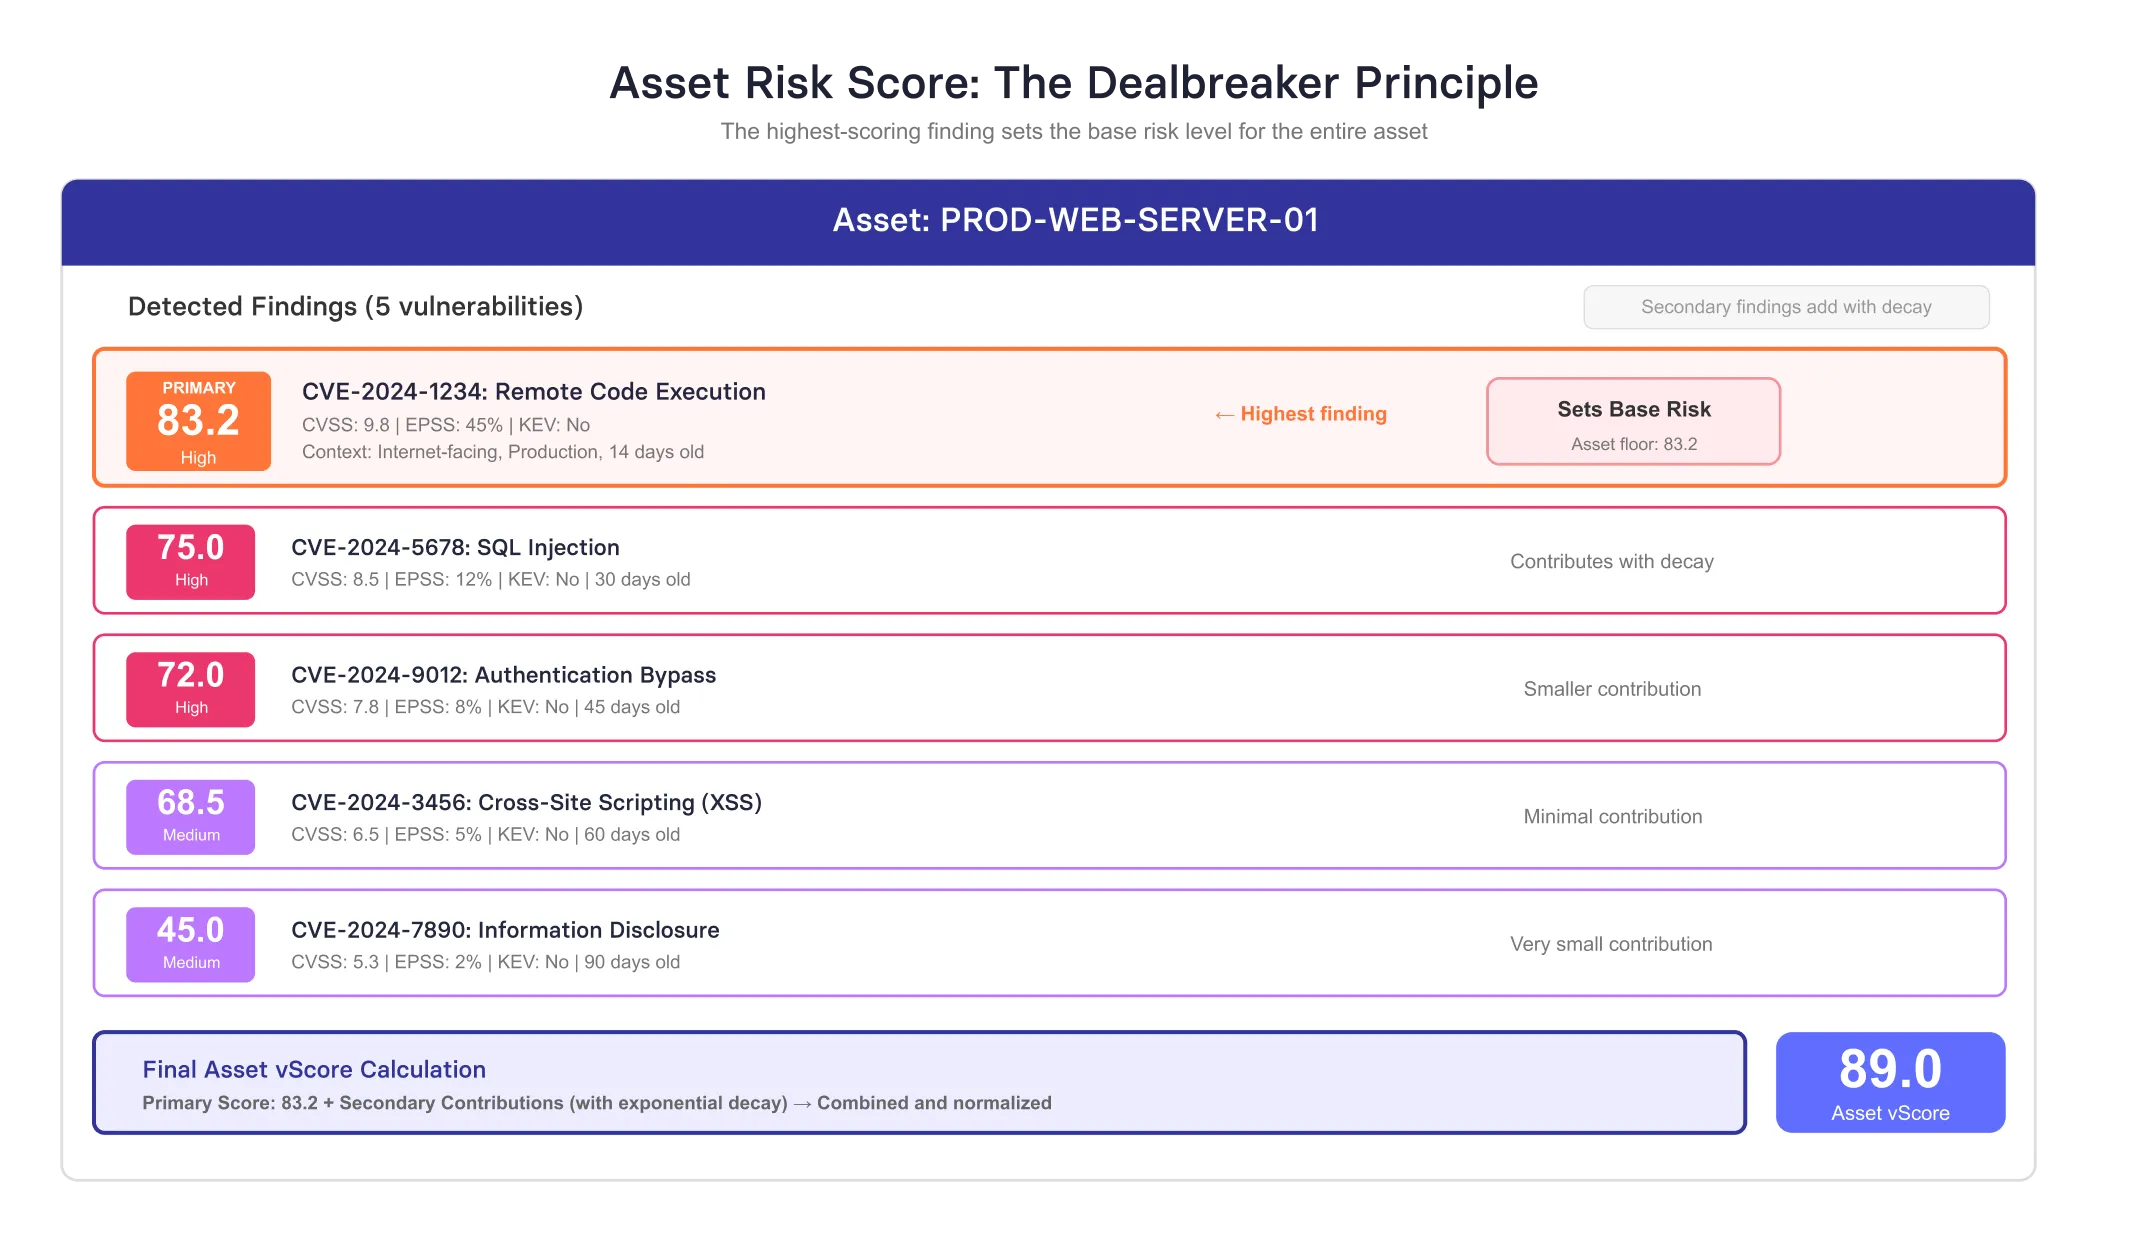
Primary Risk: the highest finding sets the floor
Primary Score equals the highest individual finding score on the asset.
The most severe vulnerability dominates the asset's risk profile. This reflects the defensive reality: attackers only need one entry point.
Secondary Findings: diminishing contributions
Additional vulnerabilities increase risk, but with exponentially decreasing impact:
Secondary Risk is calculated by adding contributions from remaining findings, with each successive finding contributing less than the previous.
Starting from the second-ranked finding (i=2):
- 2nd finding: Contributes a small % of its score
- 3rd finding: Contributes much smaller % of its score
- 4th finding: Contributes minimal % of its score
- 5th finding: Contributes negligible % of its score
This diminishing contribution model reflects the principle of diminishing marginal risk: fixing the worst vulnerability provides the greatest risk reduction.
Final asset risk score
Asset vScore combines the Primary Score with Secondary Risk contributions, filling the remaining gap toward 100 based on additional findings.
The asymptotic function ensures secondary findings can only fill the remaining space toward 100, never exceeding it regardless of finding count.
Complete example:
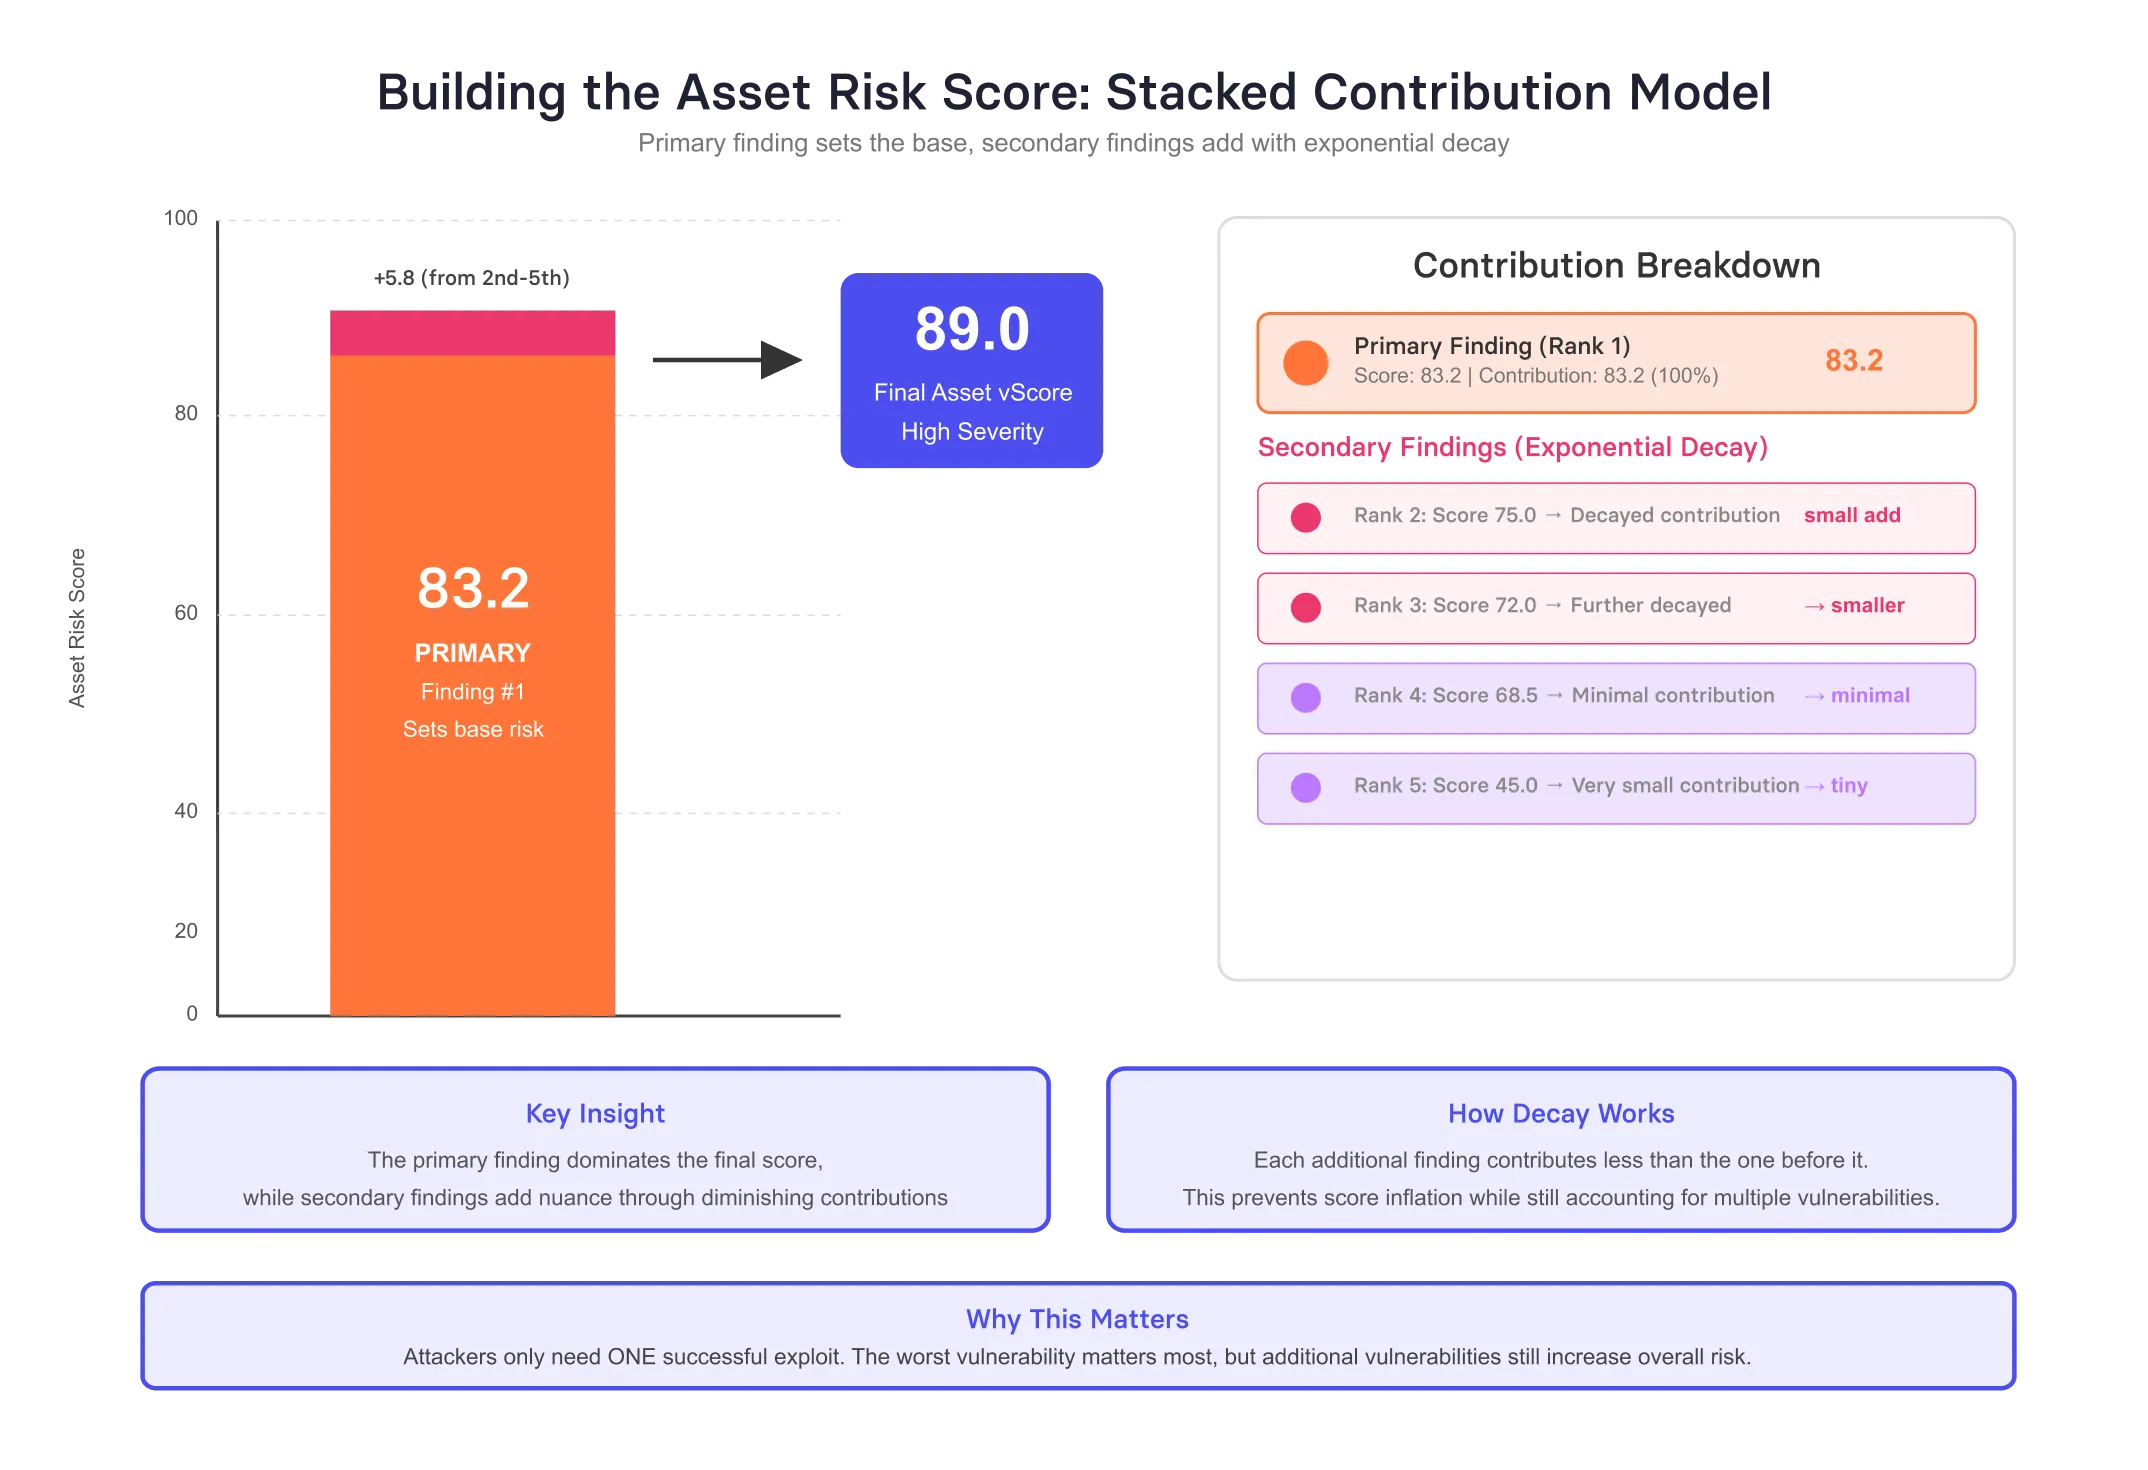
Asset with five findings scoring: 83.2, 75.0, 72.0, 68.5, 45.0
- Primary Score = 83.2 (highest finding)
- Room to fill = 16.8 points remaining toward maximum score of 100
- Secondary contributions = Each additional finding adds a diminishing contribution (2nd adds most, 5th adds least)
- Fill amount = 5.8 points added from secondary findings
- Final Asset vScore = Primary (83.2) + Secondary additions (5.8) = 89.0
This asset scores as High severity (70-89.99 range), elevated from the low-80s by its additional vulnerabilities, but prevented from jumping to Critical (90+) because the primary finding wasn't in that tier.
Why this mnathematical approach works
The three-layer model succeeds because it respects fundamental principles:
1. Risk is multiplicative, not additive. Impact × Likelihood correctly models risk relationships. A zero-threat vulnerability poses zero risk regardless of severity; a zero-impact vulnerability poses zero risk regardless of threat.
2. Conditional logic matters. KEV evidence (confirmed exploitation) properly supersedes EPSS predictions (probabilistic forecasts) through probabilistic union mathematics.
3. Context amplifies risk. Business criticality multiplies vulnerability severity the same flaw on different assets represents genuinely different organizational risks.
4. Aggregation reflects defensive reality. The highest vulnerability dominates because attackers need only one successful entry point. Additional vulnerabilities matter, but with diminishing returns.
5. Mathematical bounds prevent distortion. Logarithmic dampening and asymptotic normalization keep scores interpretable and prevent extreme outliers from breaking the scale.
6. Every calculation is auditable. Each score component is traceable, explainable, and mathematically defensible critical for stakeholder trust and compliance reporting.
From theory to practice
This framework transforms vulnerability management from an overwhelming fire drill into a rational, priority-driven process. Security teams can confidently answer the fundamental question: "What should I fix first?"
A CVSS Critical vulnerability with no exploitation evidence and low business context might score 45 (Medium). Meanwhile, a CVSS High vulnerability that's actively exploited (KEV), affects an internet-facing production system, and has been unpatched for 90 days might score 95 (Critical). The traditional approach would reverse these priorities.
The result is dramatic: organizations report 60-80% reductions in mean-time-to-remediate (MTTR) for genuinely critical vulnerabilities by eliminating the noise of thousands of equally-marked "Critical" findings that pose minimal actual risk.
This mathematical rigor is what separates modern risk-based vulnerability management from legacy severity-based approaches. By combining the best available threat intelligence with organizational context through sound probabilistic and risk management mathematics, vRx delivers what security teams need most: clear, defensible, and accurate priorities.
































.webp)




























%20Signals%20a%20New%20Era%20of%20Supply%20Chain%20Risk.webp)











.webp)